My farm is located in Bywong and consists of 9.62 hectares. The soil is shale-based and half the property has minimal top soil with large rock shelfs and outcrops. The block slopes towards the west and the demonstration plots are located on the flat section on the western side of the property. The demonstration plots receive full sun all day.
Read this report as a PDF file
The property was subject of subdivision in the early 1990’s. Prior to the subdivision, I understand that the owner had a small flock of goats to help keep the grass under control. The property since the subdivision has had no fertiliser, pasture improvement activity or grazing stock. A separate 1 hectare paddock was established on the property in 2015. This single paddock was cultivated, limed and is irrigated. The remainder of the property is one single paddock and is only grazed by kangaroos, rabbits, wild ducks and hares.
Pasture composition on the farm includes both native and introduced grass species but not all are present in the demonstration plots. Whilst there are other groundcovers present on the property and in the demonstration plots, I do not know their names. The highlighted grasses are known to be in at least one the demonstration plots.
- Cocksfoot (Dactylis glomerata)
- Kangaroo Grass (Themeda australis)
- Lomandra
- Redgrass (Bothriochloa macra)
- Subclover
- Wallaby grasses (Rytidosperma spp.)
- Weeping grass (Microlaena stipoides)
Like all of us, there are also weeds in the demonstration plots including moss, cape weed and serrated tussock. The serrated tussocks will be chipped and removed rather than using a herbicide.
I have constructed a temporary fence around the demonstration plots in an attempt to restrict the native grazing.
With the demonstration plots, I aimed to use a minimalistic approach by using only those implements or materials at my disposal or readily obtainable at a reasonable cost.
Soil tests were taken from each of the plots and divided into the various soil layers for analysis. The CT122 soil test was conducted on the layers 0 – 5 cm and 5- 10 cm while CT 179 was conducted on the layers 10-15cm and 15-20cm. Samples from each layer within the plots were combined. Separate samples for the same layers were taken from another section of the paddock that had better ground cover. This was done to see if there were any notable differences to explain the lack of ground cover in the demonstration plots.
Figure 1 Soil profile September 2020

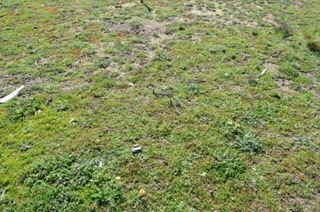
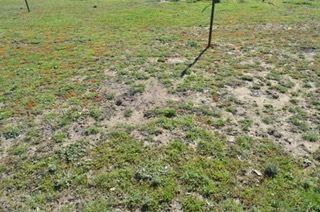
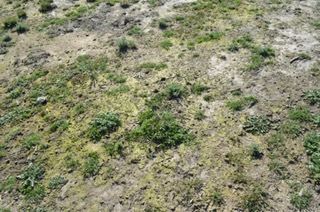
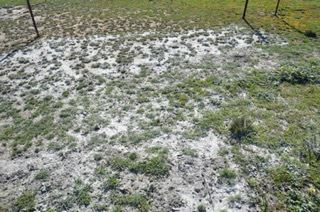
The Common Control plot is 10m X 5m. This allows for native grass seeds to be broadcast in April / May 2021 on half of the control (5m X 5m) to demonstrate the effect of only seed being distributed. The photos below show the control plot in September 2020.
The three (3) remaining demonstration plots (Common Improved, Variation 1 and Variation 2) were subject of the addition of agricultural lime to increase the soil pH to the target of pH5.5. To effect this change from the initial pH of 4.3 to 5.5 approximately 3.8kgs of lime per 25m2 needed to be added. The superfine lime was weighed and distributed using a bucket with holes (approximately 6mm) drilled in the base. While this was adequate for the demonstration plots or a small problematic area, I do not consider this to be a viable method for an complete paddock. A drop spreader or a belt driven spreader would be more suited to larger distribution of superfine lime.
Figure2 Agricultural lime

Figure 3 Weighed lime

Figure 4 Lime bucket

COMMON IMPROVED PLOT
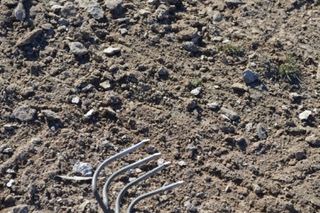
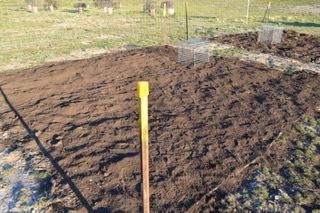
The Common Improved plot had lime added to the surface and was to be incorporated to a depth of 5cm by hand. My compact soil did not allow for the lime to be incorporated to that depth and was “scratched” into a maximum depth of 2cm. The green manure crop consisting of 90% ryecorn and 10% crimson clover was broadcast across the plot at a rate of 40 grams per m2. This equates to 400 kilograms per hectare which maybe high but the green manure crop was sown late and the rate is to help compensate for a potential lower germination rate. The Common Improved plot was then covered with jute mesh. The jute mesh as covered with compost obtained from the Queanbeyan Palerang Regional Council Waste Minimisation Centre.
The photos below show the Common Improved plot in September 2020 before treatment.


Here is the plot after spreading lime and then after incorporating lime.

And then after sowing green manure and covering with jute mesh.

After spreading the compost.
VARIATION 1 PLOT
The Variation 1 plot had lime distributed in the same manner as the Common Improved plot. For this plot mechanical means were used to incorporate the lime. The four tines on a box grader were used to break up the soil to a depth of approximately 10cm. The green manure crop was then broadcast at the same rate of 40 grams per m2. The plot was then covered with the compost obtained from the Queanbeyan Palerang Regional Council Waste Minimisation Centre. Ideally the ripped area could have been “smoothed” to break up the larger pieces with field harrows or a crumble cage attached to the rear of the box grader. Neither was available to me when initiating this demonstration plot.
Variation 1 plot in September 2020 before treatment.
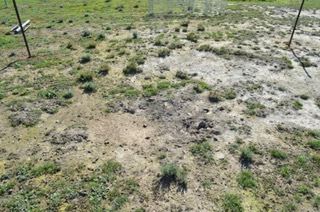
Variation 1 plot after spreading lime.
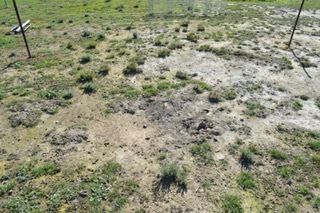
Incorporating lime in Variation 1 plot.

Green manure seed broadcast on Variation Plot 1.
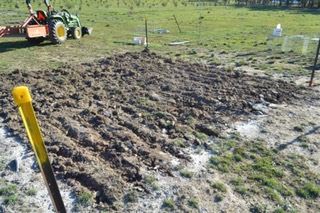
Compost spread on Variation Plot 1.

VARIATION 2 PLOT
The variation plot 2 was completed a little later (5 days) after the common and control plots. This variation 2 was without any physical incorporation of the treatments to the plot. It was based on comments made by several farmers about the improved grasses they had from where round or large square bails had been left for stock to graze on. Their comments were that the seed in the meadow hay coupled with the animal foot traffic and manure from the stock created an environment for improvement in grass ground cover in that area once rested.
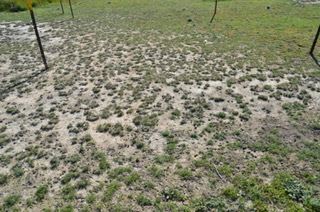
Variation 2 plot in September 2020 before treatment.
The lime was distributed by the same manner as the Common Improved plot and left on the surface and not incorporated. The green manure crop was then broadcast at the same rate of 40 grams per m2. The plot was then lightly covered with meadow hay. Only half a small bale was used for the 25m2. Pelletised poultry manure (Dynamic lifter) was broadcast on this plot at the same rate as the green manure crop of 40 grams per m2. I believe that this is consistent with application rates for pasture of between 150 and 400 kg per hectare. The variation plot 2 was then also covered with the compost obtained from the Queanbeyan Palerang Regional Council waste minimisation centre.
Variation 2 plot after spreading lime.
What has happened so far
Three weeks later
We have had good rain in September with over 40mm recorded and much warmer weather. For me it has been a good start to spring but the yellow cape weed is very noticeable in the farm landscapes.
The compost on both the Common and Variation 1 plots moved slightly with the rain but there was no significant loss or erosion. More compost was washed from the demonstration plot in the Common plot than in Variation 1 plot. It would appear that the compost “settled” into the rips in the Variation 1 plot. Variation 2 plot had little or no movement of the compost.
The green manure crop has germinated in both the Common and Variation 1 plots but there is no germination visible in the Variation 2 plot. The germination of the green manure crop has been within 21 days of broadcasting the seed. Variation 2 plot lack of germination may be due to the sightly later completion of the demonstration plot but I hope that by the end of September there will be germination in this plot also.
Allan


